Revisiting the cost of waiting on builds
It’s been nearly a year since I first looked into the cost of waiting on builds (series). It got picked up by GitHub’s blog and it’s still tied with the time I spoke at a CNCF conference for page views every month. Since I need some updated build benchmarks for an upcoming project, this seemed like a fabulous time to re-run the experiment and update it to account for the recent economic shifts.
I’d assumed that like every year in tech, quite a bit has changed - but I was only partially right!
Technical changes
There were some technical changes to GitHub’s larger runners in that time. This time around, it’s publicly available (release notes ) and not in a private beta. The new runners are using Ubuntu 22.04 (Jammy Jellyfish), not Ubuntu 20.04 (Focal Fossa). Now we’re also building newer versions of the Linux kernel for Fedora to stay in line with what’s current - releases 37, 38, and the upstream development build for 39.
Economic changes
Apart from widespread hand-wringing about unprecedented macroeconomic conditions1 in the press, for the scope of this trial, I was surprised at how little needed updating.
Despite downward pressure on compensation packages at the top of the market2, developer time is still getting more valuable on average after being adjusted for inflation, albeit not uniformly. The latest Stack Overflow survey shows this as well. From the 2021 survey to the 2023 survey , here’s a couple highlights of compensation changes3 in the United States:
| Role | 2021 Salary (inflation adjusted) |
2023 Salary | Real change | Hourly cost with benefits4 |
|---|---|---|---|---|
| Full stack dev | $120,000 $135,572 |
$140,000 |
+3.3% | $87.50 |
| Front-end dev | $115,000 $129,923 |
$140,000 |
+7.8% | $87.50 |
| Mobile dev | $120,000 $135,572 |
$163,000 |
+20.2% | $101.88 |
| Backend dev | $133,000 $150,259 |
$165,000 |
+9.8% | $103.13 |
| DevOps specialist | $135,000 $152,518 |
$160,000 |
+4.9% | $100.00 |
Compute continues to get cheaper and more available as well. I didn’t want to dive too deep into the cost of compute per floating point operation per second improvement, but there’s some great research into this space specific to your use cases. I’ll stick to the Wikipedia approximation of the cost halving between September 2022 and May 2023.
For the cost analysis below, I’ll use the lower side of $90/hr for developer time.
Experiment design
This time around, I needed a bit more data for my upcoming project’s benchmarks, so I took the average of 3 runs spread across time of day to account for any “peaky” workloads. I also used a broader array of builds:
- 3 versions of Fedora (37, 38, and dev branch of 39)
- 2 types of builds (debug build and non-debug build)
- 6 compute SKUs (using GitHub’s hosted runners at each available tier)
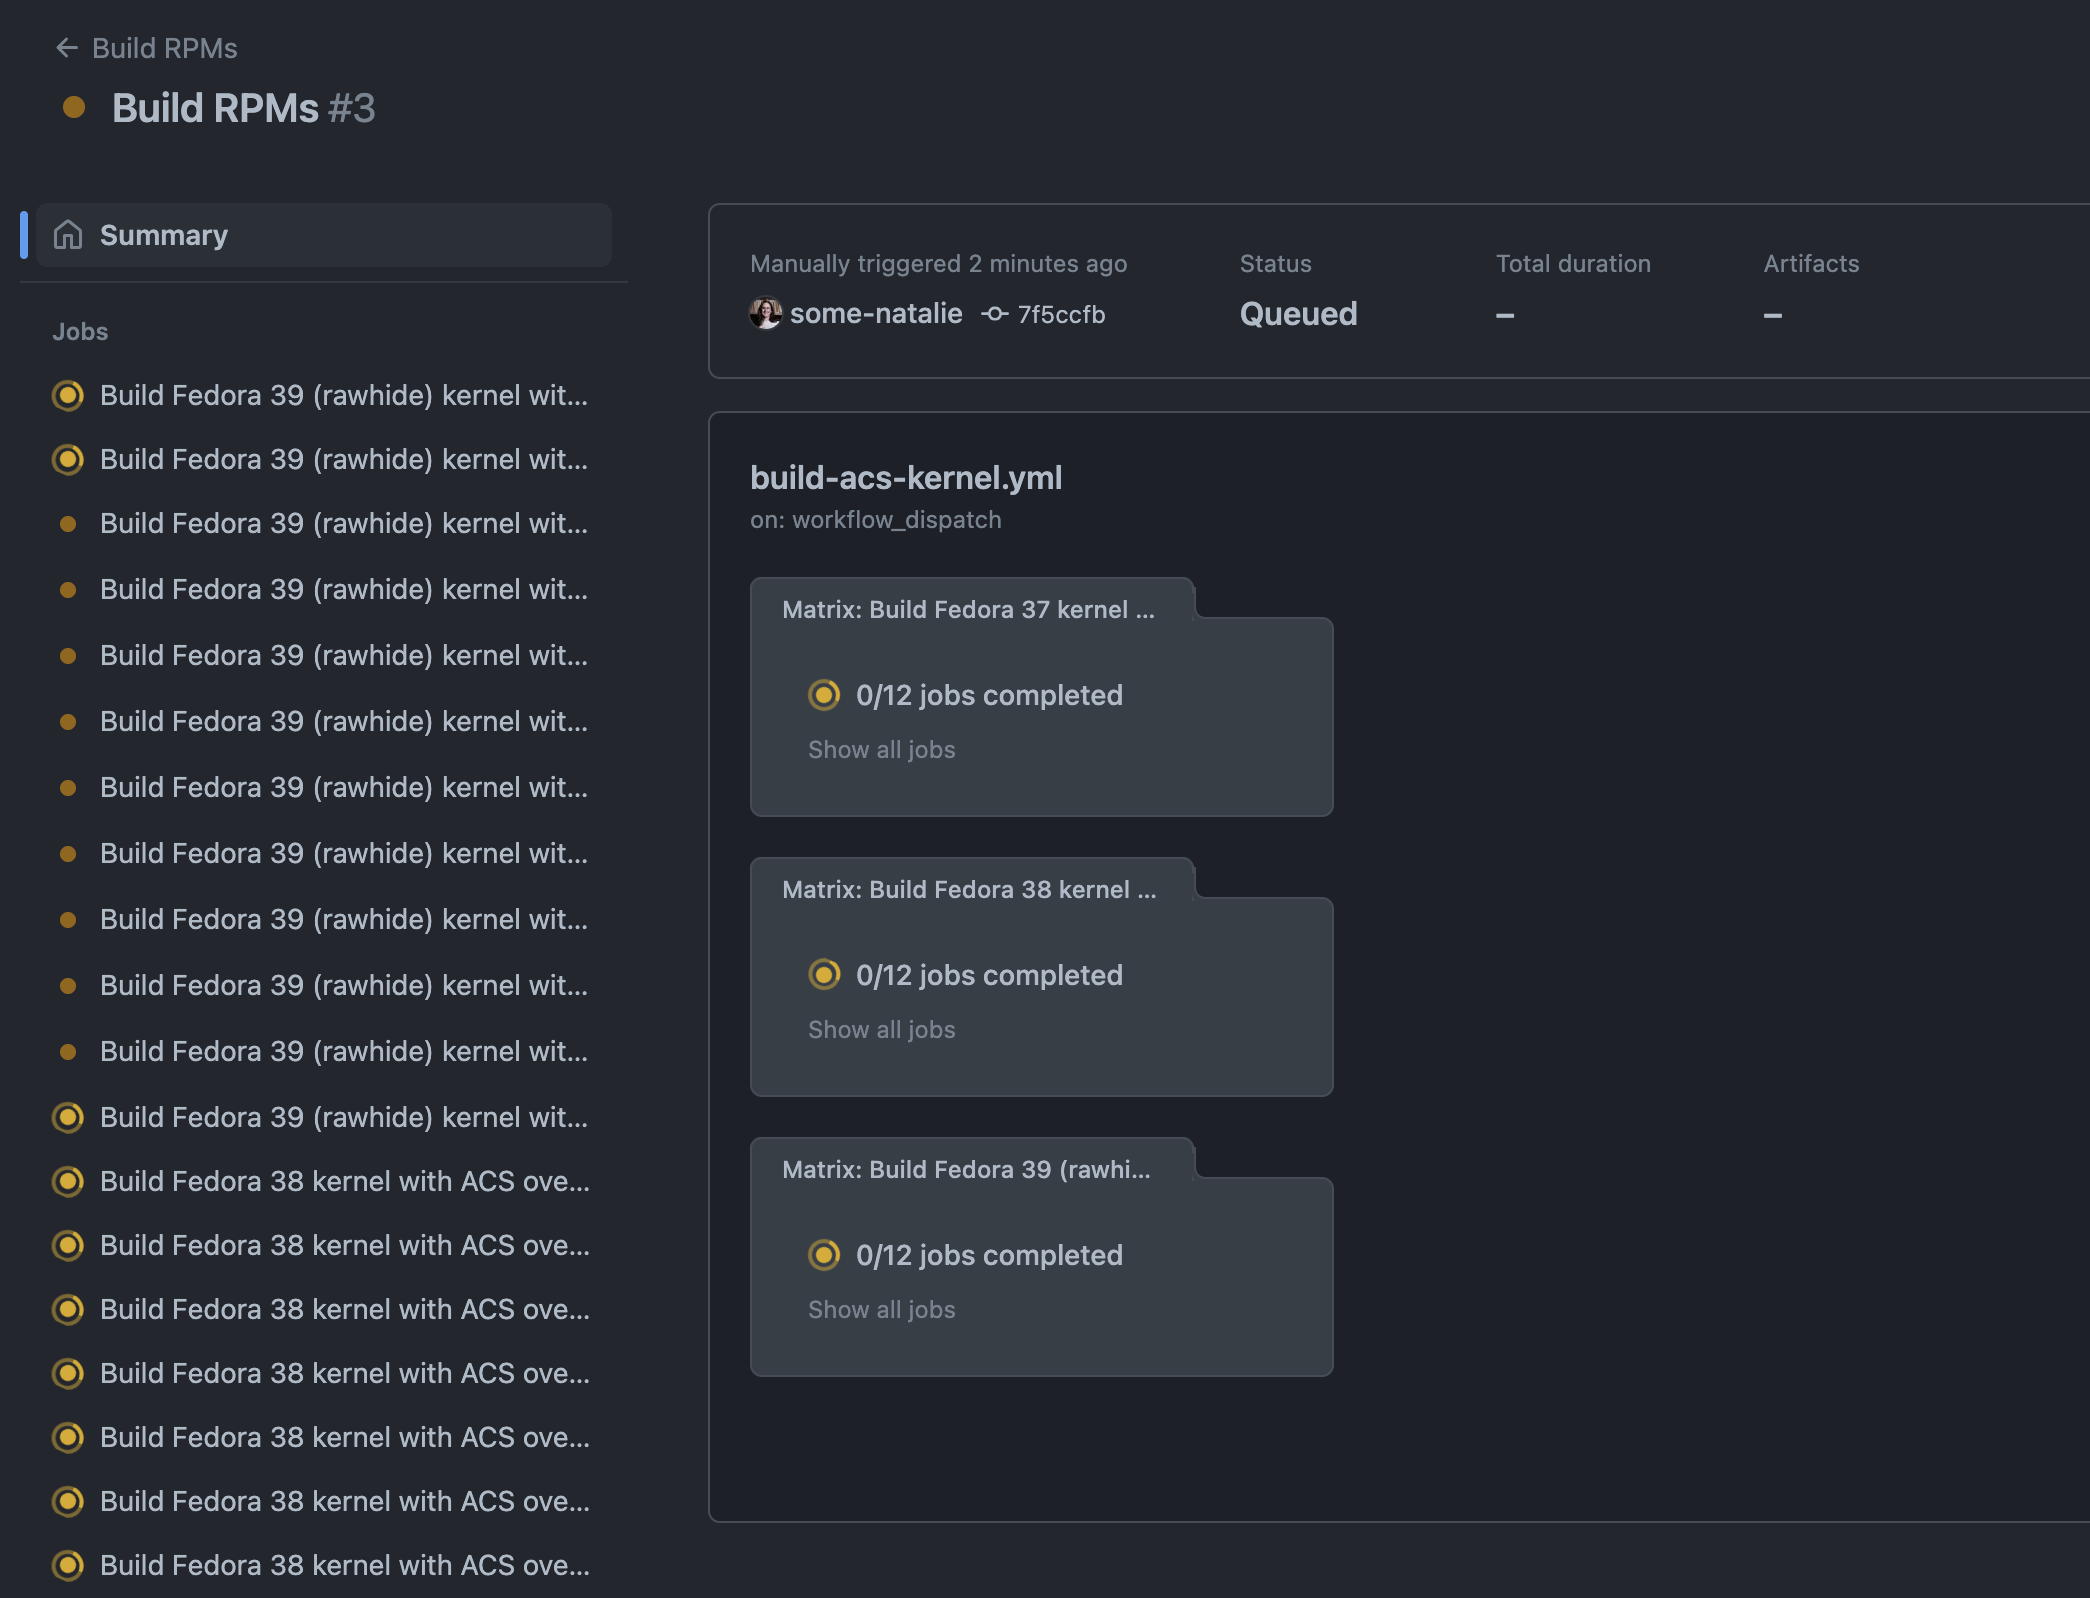 hitting “run” felt pretty good …
This gave me a total of 108 data points to work with. Producing 36 unique builds on each run, the workflow file defining the test (link ) is remarkably short because of concurrent matrix strategies . Since each kernel version has slightly different build steps, it’s quite verbose at about 100 lines. If the builds between kernel versions were more similar, it’d end up at about 35 lines of YAML in total for 36 jobs!
Here’s a walkthrough of how one of the builds is created:
1
2
3
4
5
6
7
8
9
10
11
12
13
14
15
16
17
18
19
20
21
22
23
24
25
26
27
28
29
30

jobs:
  build-fc39:
    strategy:
      fail-fast: false # don't fail the remaining jobs if one fails
      matrix:
        runner-size: # each compute tier
          [
            ubuntu-latest,
            jammy-4core,
            jammy-8core,
            jammy-16core,
            jammy-32core,
            jammy-64core,
          ]
        debug: ["true", "false"] # whether to build the debug log
    runs-on: ${{ matrix.runner-size }} # using the compute tier matrix
    name: Build Fedora 39 (rawhide) kernel with ACS override patch
    steps:
      - name: Checkout this repo
        uses: actions/checkout@v3

      - name: Free up disk space
        uses: ./free-space # custom Action to delete lots of stuff
        # needed for debug builds on the 2 core runners only

      - name: Build the Fedora 39 RPMs
        id: build-rpms
        uses: ./fc39-action # the custom build action for Fedora 39
        with:
          debug-build: ${{ matrix.debug }} # passing in the debug matrix value
Results
| Average | 2-core | 4-core | 8-core | 16-core | 32-core | 64-core |
|---|---|---|---|---|---|---|
| normal build |
2:19:32 | 1:15:04 | 0:42:14 | 0:25:47 | 0:18:06 | 0:14:37 |
| debug build |
5:57:33 * | 3:03:41 | 1:39:50 | 0:59:12 | 0:39:08 | 0:31:05 |
*at least one build in every run for this combination timed out incomplete at 6 hours.
Adding in the increased cost of labor, this now looks even more compelling to just use larger compute for CPU intensive jobs (same for GPU intensive workloads, or whatever your specific hardware limitation may be). I skipped writing out a bunch of the calculations I did a year ago, but here’s the full spreadsheet to check my work.5
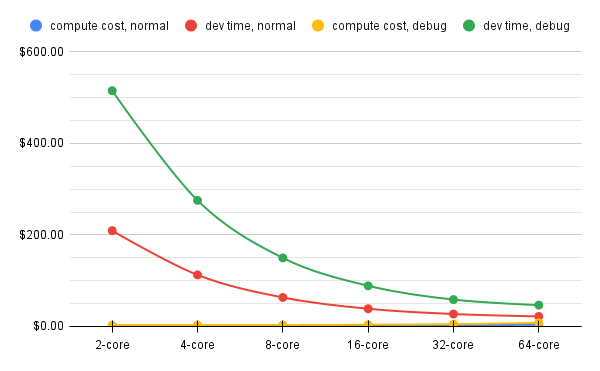
This is a textbook example of questionable data visualization. Due to the huge difference between the cost of people time versus computer time, it’s difficult to tell how compute costs changes over each tier. It’s miniscule in comparison to the cost of people time at every point, which is the only reason I’m halfway okay making such a bad chart. 💖
If you’d like to look further into this data or reproduce the experiment, here’s the source code . The spreadsheet of data and all build logs from this are preserved here . 👩🔬
Analysis
The overall build times of newer versions of Fedora have been trending upward for a while, as noted by looking back at the 2-core runners used over time in the upstream project . The development kernel takes slightly less than released versions too, by a small amount.
Despite the time of day and long run time of the jobs, they’d all end up within a couple minutes of each other - suggesting it doesn’t really matter when you run the job. Note the small sample size for this test does cast doubt on this observation, but finding true variation wasn’t the bigger goal of this benchmark.
I was surprised that it was this simple to find a job that couldn’t reliably complete in 6 hours that wasn’t mining cryptocurrency or similar tasks. In every run, the debug build running on the 2 core runner failed at least once. No correlation can be made between Fedora version and failure and it’s not worth investigating further.
Conclusions
Developer time at a conservative cost of $1.50 per minute ($90/hr) still seems outright silly to waste to save a couple pennies on compute cost. It’s just as true now as it was at $75/hr. The same is also true of laptops or noise-canceling headphones or leaving a bunch of Slack channels - saving focus time where it’s most impactful to the business is almost always a worthwhile expense.
Footnotes
-
I’m on the older side of Millennial and this is my third or fourth “once in a lifetime” macroeconomic catastrophe. I’m unperturbed by apocalyptic economics journalism at this point. 😑 ↩
-
The 2021 Stack Overflow developer survey was published in May 2021 (methodology ). The 2023 survey was published in May 2023 (methodology ). I used the United States Bureau of Labor Statistics’ Consumer Price Index inflation calculator to adjust to May 2023. ↩
-
Same approximate +25% cost to include taxes, insurance, fringe benefits, etc. that I used in the original piece. This varies quite a lot by locality and I hate doing taxes. Use your own adjustment factor here. Assuming 40 hours per week and 50 weeks per year, which is another US-centric convention. ↩
-
Fun fact, the compute for this cost about $330. 💸 ↩